Media Changes Tune On Housing Market (Crash Is Here)(?)(!)

Are you as confused and annoyed by the mixed signals we are getting lately about where mortgage rates are going? You’ve heard the media telling us...if you don't buy a house now you will be MISSING OUT!!!

Hmmm...that FOMO peddling sounds vaguely familiar, right? Not too long ago we were "living our best Covid lives" dancing along with pretty TikTok-ers making sourdough bread.
I am to no end annoyed by their predatory messaging: Hey kids if you don't buy a house now, you WILL be missing out on the greatest opportunity for wealth in your entire lifetime.
Hold up. The truth is, you cannot trust mainstream media when they tell you that when the Fed continues to do rate cuts, mortgage rates will get down to 4% or even 3%. A few months ago mainstream media were telling folks ‘don't worry mortgage rates will go down as the Feds keep cutting’, as if what the Fed does with interest rates have any influence on how mortgage rates behave. Now they are telling you the opposite...y'all better buy a house now, because if you don't you will be in an even worse position because mortgage rates will continue to go up. Mainstream media have completely reversed their tune y'all.
CNN just a week ago put out an article saying that if you didn't buy a home in the last six months when the Fed cut rates...too bad, so sad, you made a mistake. And to add more water to an already boiling over pot, I still hear licensed professionals encouraging folks to date the rate. This, in my opinion, is absolutely the worst advice to hit us since they said skinny jeans make everyone look good. I don’t mean to trivialize what is happening to my neighbors in our housing market by comparing it to the skinny jean trend..but can we all agree that we are happy it’s finally going away?
They are finally right about one thing though: the Fed will likely continue cutting rates through the end of 2024, but this won't make housing any more affordable my friends. In fact, owning a home has never been more costly than it is today. It's hard to watch the news without feeling disheartened by the headlines about massive price drops in Texas, widespread issues in Florida, and a struggling housing market in New York. Property taxes are soaring, HOAs are out of control, and interest rates are expected to remain above 6% for at least the next two years. (Of course, this rate prediction comes from the National Association of Realtors, one of the largest lobbying groups in the U.S., so take it with a grain of salt. *discalaimer, I am a member of NAR).
They claim that if you had purchased a home six months ago, you would be ahead now, but the truth is that anyone who bought recently in those markets is likely seeing their property values plummet. With skyrocketing assessments, record-high home insurance rates, and no assurance that insurance companies will support their clients during crises, the situation looks bleak.
If you feel the pressure is on to buy a house as soon as possible because it's only going to get more expensive, well you're not totally wrong about that. However, you must have your head in the deal game and rely more on what the data is telling you. Rely less on what folks like Barbra Corcoran say when they get up one morning and decide to preach to you in the soft light of the CNN or FOX studios. This isn't an episode of the Shark Tank..this is your financial health, so take the data seriously. Let's dive in and talk numbers shall we?
Analyzing the Current Market
Seasonal Trends in Home Prices and Mortgage Rates

As we delve into the current state of the housing market, it's evident that there are seasonal fluctuations influencing both home prices and mortgage rates. Typically, home prices peak during the late summer months, as observed in June 2023, and similarly in previous years. This pattern aligns with the data from June 2022 and the peak around June and July in 2023.
Historical Context and Mortgage Rate Fluctuations


In January 2021, mortgage rates reached an unprecedented low of approximately 2.7%. This significant decrease sparked a notable rise in home prices later that year, especially in August, when the average rate for refinancing stood at around 2.75%. These exceptionally low rates played a crucial role in driving up home prices as the year progressed.
Year-Over-Year Home Price Changes:
2021 : Home prices saw a significant increase, up by 18% year-over-year, which was an unsustainable surge in the market.
2022: The increase was more moderate at 8%, reflecting a slight cooling from the previous year.
2023: Currently, home prices are up by approximately 4% from the same time last year, indicating a return to more normal growth rates in the range of 3-5%.
Mortgage Payments and Interest Rates

*Rates go up from July to August 2024
In August 2024, the average monthly mortgage payment rose to $2,667, calculated at an interest rate of 6.78% according to Freddie Mac's latest data as of August 1st. This rate is based on a weekly survey and may differ from daily rates, which were lower at the end of the first week. Despite this, the current mortgage payment is only $168 below the all-time high set a few months ago, reflecting the ongoing pressure on affordability. If it seems like there are forces invisible to the naked eye contributing to what influences mortgage rates, you have good intuition.
The mortgage industry has long advised homebuyers to follow the "30% rule," which suggests that housing expenses, including mortgage payments, should not exceed 30% of one's income. This guideline has traditionally been used to determine an acceptable debt-to-income ratio for homebuyers. However, the NerdWallet quarterly First-Time Homebuyer Affordability Report indicates that adhering to this principle has become increasingly difficult in the current real estate market, primarily due to rapidly rising home prices.
Dynamics of Current Home Sales and Listings


Pending Home Sales
Pending home sales, a leading indicator of housing market activity, fell by nearly 6% in the four weeks ending July 28th. This is the largest decrease in nearly nine months, which could be a precursor to changes in the market, especially considering the recent drop in interest rates.
New and Active Listings
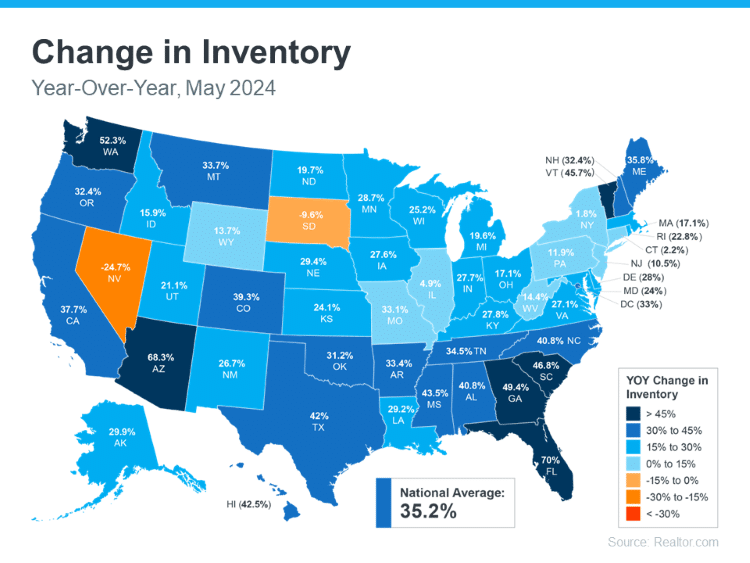
While new listings increased by 4%, this was the smallest increase in nearly nine months. Active listings, which represent the total housing inventory, rose by nearly 19%, yet this too was the smallest increase in about three months.
These trends suggest that while there is a decrease in demand, the inventory is not increasing at a rate that would suggest a market crash.
Analyzing the Supply and Demand


The supply side shows a modest (not substantial..calm down NAR) 4% year-over-year increase in new listings, significantly lower than the double-digit increases seen earlier in the year. On the demand side, there's a notable decrease in pending home sales , with a 5.7% drop from the previous year, indicating a significant reduction in buyer activity. This decrease in pending sales is a critical factor to watch, as it could signal a potential shift in the market dynamics.
Active Listings and Inventory Trends
Active listings have shown an unusual pattern, peaking in June rather than the late summer months, which is atypical for the housing market. This early peak suggests a shift in the usual seasonal trends and could impact future home prices and market stability. Despite this peak, we are still experiencing a three-year high in active listings for the same timeframe, indicating a more robust inventory than in recent years.
Month Supply of Homes
The current month supply of homes stands at 3.8 months, which is an increase of 0.8 percentage points from last year. This figure represents how long it would take to sell all current listings at the current sales pace if no new listings were added. A balanced market typically has a 4-5 month supply, so while we are closer to this range, the market still slightly favors sellers.
Variations in Regions and Metro Analysis

Different regions and metros are experiencing varying trends:
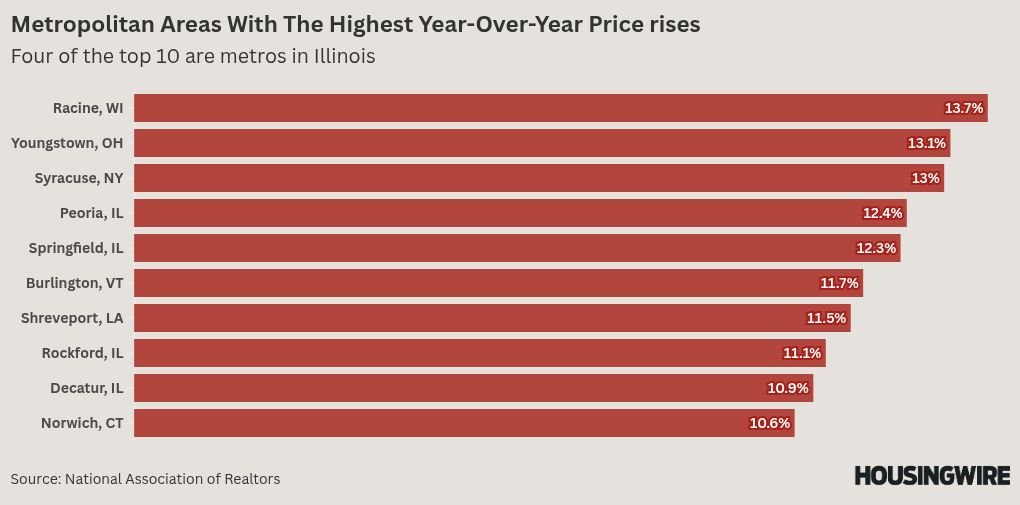
Detroit, Michigan: Leads with a significant increase in median sale prices, up by 17.2% year-over-year.
New Brunswick, New Jersey: Follows with a 15% increase.
Providence, Rhode Island and Milwaukee, Wisconsin: Both have seen substantial price increases of over 13%.
Conversely, Austin and Dallas have seen slight decreases in home prices, indicating regional disparities in market conditions.
Market Predictions and Future Trends
Looking ahead, the housing market's future will largely depend on the interplay between supply and demand. If pending home sales continue to decrease and new listings do not rise significantly, we could see a shift towards a more balanced or even a buyer's market. However, the current data suggests a gradual adjustment rather than a sudden market downturn.
Food for thought: Two things can be true at once: It will be a buyer's market for awhile, and buyers are priced out.
Impact of External Factors
External factors such as economic policies, interest rates, and global events also play a crucial role in shaping the housing market. For instance, any changes in federal interest rates can directly impact mortgage rates, influencing both buyer affordability and market dynamics.
The housing market is exhibiting signs of a gradual shift towards normalization after the unprecedented fluctuations of the past few years. While the market still slightly favors sellers, the increasing month supply and regional variations indicate that we may be moving towards a more balanced market. Homeowners, buyers, and investors should keep a close eye on these trends as they plan their next steps in the housing market.
The month supply of homes, a critical indicator of market balance, has seen a noticeable increase this year. As of now, the month supply stands at 3.8 months, up from 3 months at the same time last year. This increase is part of a seasonal trend observed in June and July each year, with the exception of 2021 when the market experienced near-record low rates.
Historical Perspective on Month Supply
July 2019: Month supply was at 4.2 months.
July 2018: Month supply stood at 4.3 months.
July 2017: The figure was again at 4.2 months.
July 2016: Month supply was higher at 4.7 months.
The average for July from 2016 through 2019 was approximately 4.4 months, indicating that while the current supply is a three-year high, it is still below the historical norms of pre-COVID levels.
Regional Analysis of Home Prices and Sales


The dynamics of home prices and sales vary significantly across different regions and metros. Here’s a closer look at some specific areas:
The Top Performers in Home Price Increases:
Detroit, Michigan: Led the nation with a 17.2% increase in median sale prices year-over-year.
New Brunswick, New Jersey: Saw a 15% increase.
Providence, Rhode Island and Milwaukee, Wisconsin: Both experienced significant increases, with Providence at 13.6% and Milwaukee at 13.3%.
The Metros with Declining Home Prices:
Austin, Texas: Experienced a decrease of 2.3%.
Dallas, Texas: Saw a slight decrease of 4%.
Pending Home Sales Insights
Gains: Only seven metros posted gains in pending home sales from the previous year, including San Francisco, California, and Miami, Florida, which saw increases of 3.2% and 2.8%, respectively.
Losses: The majority of metros experienced declines, with significant drops in cities like Phoenix, Arizona, and Las Vegas, Nevada, where pending sales fell by 5.7% and 6.1%.
Understanding the Shifts in Market Dynamics
Real estate markets dance to their own tuned and are hyper local, with home prices and sales fluctuating from region to region. While some areas enjoy robust growth, others grapple with declines, reflecting the diverse economic and demographic forces at play. These localized trends are crucial for both homebuyers and investors to understand before making any decisions.
The Influence of Economic Policies on Regional Markets
Economic policies, including tax incentives and zoning regulations, significantly impact regional real estate markets. For instance, areas with favorable tax conditions and growth-friendly policies tend to attract more residents and investors, which boosts home prices and sales activity. Conversely, regions with restrictive policies may see a stagnation or decline in market dynamics.
Future Outlook and Strategic Considerations
As we move forward, the real estate market will continue to adapt to the ongoing economic and demographic shifts. To make informed decisions, it's crucial to stay updated on national trends and local market conditions. If you have any questions about the Texas real estate market in particular, call me! There isn’t a whole lot I love more these days than talking real estate.
Strategic Buying and Selling Tips
For Buyers: Focus on areas with strong economic growth and stable job markets. Consider the long-term potential of the area and factor in the total cost of homeownership, including taxes and insurance.
For Sellers: Emphasize the unique features of your property and community. Be realistic about pricing, especially in markets experiencing a slowdown. Timing is everything, there are ways to make sure that your sale coincides with peak buyer activity in your region.
Navigating Market Uncertainties
The real estate market is inherently unpredictable y’all. Understand the underlying factors. By being adaptable, you will be able to navigate these challenges with efficiency. The key is: BE ADAPTABLE. Whether you're a first-time homebuyer or on your tenth investment property. Staying informed is a discipline. Adjusting your strategies accordingly is the key to not loosing your shirt.
FOCUS ON PURCHASE PRICE, NOT RATES!
The real estate market is a complex and dynamic lover my friends, influenced by a world of seemingly invisible factors such as economic policies, demographic shifts, and regional disparities. It’s VERY easy to be seduced by her. The good news is, you can have a healthy relationship with your housing market. By analyzing these elements and staying informed, you can make more strategic decisions and navigate the market with greater confidence and less risk.
As we move forward, it will be interesting to see how these trends evolve and shape the future of real estate.
Remember, whether you're buying, selling, or monitoring the market, knowledge is your most valuable asset! There are no stupid questions. Drive slow, the jerk on your back bumper will go around and be no further than you are by driving like an animal. Stay informed, stay flexible, and stay proactive in your real estate endeavors.
What are your observations and experiences in your local market? I'd love to hear about them! Feel free to share your insights, whether you're noticing similar trends or experiencing something different, as they can help me to better understand the broader market dynamics.